

If you have ever opened a sleep app and wondered, “what does sleep efficiency mean?”, the short answer is this: it tells you how much of your time in bed was actually spent asleep. It is a consolidation metric, not a full recovery score.
Key takeaways
1. Formula: Total Sleep Time divided by Total Time in Bed, multiplied by 100.
2. Example calculation: If you spend 8 hours in bed and sleep 6.5 hours, your sleep efficiency is 81.25%.
3. Simple interpretation: Sleep efficiency is about consolidation, not recovery by itself.
That distinction matters. Two people can both spend eight hours in bed, but one sleeps steadily while the other lies awake, wakes repeatedly, or starts the day too early. Sleep efficiency helps separate “I gave myself a sleep opportunity” from “my body used that opportunity well.”
The number can also mislead. Chasing a perfect percentage can push people to spend too little time in bed, which may raise efficiency while reducing total sleep. The useful question is not “How do I maximize this score?” It is “Does this number help explain my energy, mood, training readiness, focus, and daytime sleepiness?”
Where sleep efficiency fits in health and performance
Sleep efficiency sits inside the broader picture of Sleep & Recovery. It is most useful when you interpret it alongside total sleep duration, bedtime consistency, wake time consistency, stress, training load, alcohol, late meals, pain, and breathing-related signals.
For performance-minded adults, low sleep efficiency often points to one of five buckets: too much time in bed for your current sleep ability, elevated mental arousal, environmental disruption, metabolic load from alcohol or late eating, or physical disruption from pain, nocturia, breathing issues, restless legs, or medication effects. Clinical assessment of insomnia spans this same range of medical, substance, and environmental contributors, so the same percentage can mean different things depending on which bucket is driving it.
This is why sleep efficiency should not be treated like a grade. It is a clue. If it is low for one night after travel, illness, new parenthood, or acute stress, it may simply reflect life. If it stays low for several weeks and lines up with poor daytime function, it becomes more worth investigating.
Quick answer
Sleep efficiency means the percentage of your time in bed that you are actually asleep. It is commonly calculated as (total sleep time ÷ total time in bed) × 100. Higher sleep efficiency usually reflects more consolidated sleep, meaning less time awake before falling asleep, fewer or shorter awakenings during the night, and fewer early morning awakenings.
- Formula: Total Sleep Time divided by Total Time in Bed, multiplied by 100.
- Example calculation: If you spend 8 hours in bed and sleep 6.5 hours, your sleep efficiency is 81.25%.
- Simple interpretation: Sleep efficiency is about consolidation, not recovery by itself.
- Most useful pairing: Compare it with total sleep time, sleep latency, wake after sleep onset, daytime sleepiness, and schedule consistency.
- Important warning: A higher number is not always better if it comes from cutting your sleep opportunity too aggressively.
If you want to understand your own pattern rather than react to one night, track sleep duration and efficiency trends in the huuman app for 14 nights and note what changed on high versus low.
Sleep efficiency in plain English
Sleep efficiency compares time in bed with time asleep. If you get into bed at 10:30 p.m., leave bed at 6:30 a.m., and sleep for most of that window, your efficiency is likely high. If you spend long stretches awake before sleep, wake repeatedly, or lie in bed awake in the morning, efficiency falls.
This is why “I was in bed for eight hours” does not always mean “I slept eight hours.” Time in bed is your sleep opportunity window. Time asleep is what your body actually used. Sleep efficiency is the bridge between the two.
The most useful mental model is: sleep efficiency measures consolidation. It can suggest whether sleep was continuous, but it does not tell you everything about sleep depth, recovery, dream sleep, heart rate patterns, breathing quality, or how you will feel the next day.
The sleep efficiency formula and the terms that matter
The formula is simple, but the inputs can be messy. Devices, diaries, and sleep studies may estimate total sleep time differently, which is one reason your Apple Watch, Oura, WHOOP, Fitbit, and personal sleep diary may not match.
Sleep efficiency = (Total Sleep Time ÷ Total Time in Bed) × 100
- Total Sleep Time, or TST: The estimated amount of time you were asleep during the night.
- Total Time in Bed, or TIB: The full window from getting into bed intending to sleep until leaving bed for the day.
- Sleep latency: How long it takes to fall asleep. Longer latency lowers sleep efficiency.
- Wake after sleep onset, or WASO: Time spent awake after initially falling asleep. More WASO lowers sleep efficiency.
- Early morning awakening: Waking earlier than intended and staying in bed awake. This can reduce efficiency even if bedtime was consistent.
Two example calculations
Example 1: Long time in bed. You are in bed for 9 hours and sleep for 7 hours. Sleep efficiency = 7 ÷ 9 × 100 = 77.8%. The issue may not be too little time in bed. It may be that the sleep opportunity window is larger than your current sleep ability.
Example 2: Fragmented sleep. You are in bed for 8 hours and sleep for 6.5 hours because you wake several times. Sleep efficiency = 6.5 ÷ 8 × 100 = 81.25%. The driver may be continuity rather than bedtime length.
These are example calculations, not benchmarks for what your sleep should be. The useful step is identifying whether the loss is coming mainly from long sleep latency, repeated awakenings, or extra time awake in bed.
What is a good sleep efficiency?
A commonly cited reference point for “good” sleep efficiency is around 85%, especially in behavioral sleep and insomnia assessment contexts. Treat that as a rough interpretive marker, not a diagnosis and not a personal guarantee. Age, illness, stress, pain, parenting demands, shift work, medications, and tracking method can all change the number.

If you want a deeper benchmark discussion, the related guide on what a good sleep efficiency looks like focuses specifically on ranges and interpretation. For this article, the practical rule.
- Higher efficiency with adequate total sleep: Often suggests consolidated sleep. Next step: check whether you also feel alert and functional during the day.
- Higher efficiency with short total sleep: May mean you are sleeping efficiently but not long enough. Next step: compare with daytime sleepiness, mood, cravings, training readiness, and recovery signals.
- Lower efficiency with adequate total sleep: May reflect fragmentation, a long sleep window, or tracker error. Next step: look at latency, WASO, and how you feel.
- Lower efficiency with impaired daytime function: More important to address. Next step: consider structured habit changes and professional input if symptoms persist or red flags are present.
Typical sleep efficiency tends to decline with age at the population level, partly because awakenings and lighter sleep become more common. That does not mean a lower number is automatically “normal for you” or irrelevant. It means comparison should be cautious, especially when using consumer devices.
Sleep efficiency is not sleep quality, duration, or a sleep score
Sleep efficiency is narrower than sleep quality. Subjective sleep quality includes how restored you feel, whether sleep felt deep, whether you woke refreshed, and whether you function well during the day. Sleep efficiency can be high while subjective sleep quality is poor, especially when total sleep time is short or stress remains high.

It is also different from sleep duration. If you spend five hours in bed and sleep nearly all of it, your sleep efficiency may look excellent while your total sleep time may still be insufficient for your needs. That is the main way the metric gets gamed unintentionally: reducing time in bed can raise efficiency while reducing sleep opportunity.
Sleep scores add another layer of complexity. A device score may combine duration, estimated stages, heart rate, movement, breathing signals, and consistency. If you want to understand why a perfect-looking app score can clash with lived experience, the guide on what a perfect sleep score really means explains why composite scores should be.
Do not aim for 100% sleep efficiency. Some awake time in bed is normal. A healthier target is a stable pattern where you sleep enough, fall asleep without prolonged struggle, return to sleep reasonably well after normal awakenings, and function well during the day.
How wearables estimate sleep efficiency
Consumer wearables usually estimate sleep using movement, heart rate, heart rate variability, skin temperature, respiratory signals, or some combination of these. They infer when you are asleep, awake, or in a sleep stage. That can be useful for trends, but it is not the same as a clinical sleep study.
The most common error is that quiet wakefulness may be counted as sleep. If you are lying still, breathing slowly, and not checking your phone, a wearable may interpret that as light sleep. Some devices are better than others, and software updates can change estimates without any real change in your physiology.
- Sleep diary: Best for capturing your lived experience, bedtime intent, awakenings you remember, caffeine, and daytime context, with somewhat broad limits of agreement against polysomnography for exact sleep time.
- Actigraphy: Often used in research and clinical settings to estimate rest and activity patterns over many days. Still inferential, especially for quiet wakefulness.
- Polysomnography: A sleep study that directly measures more physiological signals. It is more appropriate when a clinician needs to evaluate specific sleep disorders.
- Consumer wearables: Useful for personal trends and habit feedback. Not reliable enough to diagnose insomnia disorder, obstructive sleep apnea, restless legs syndrome, periodic limb movements, or circadian rhythm sleep-wake disorders.
For iOS users, Apple Watch sleep data can be helpful when viewed as a trend rather than a verdict. If your wearable says efficiency fell, ask what changed in your day: late caffeine, alcohol, late intense training, travel, stress, pain, a warmer room, or a different bedtime window.
Evidence and limits
Sleep efficiency is widely used as a sleep continuity measure. It appears in sleep diaries, behavioral sleep medicine, actigraphy reports, clinical sleep studies, and consumer sleep tracking. Its strength is simplicity: it captures the gap between sleep opportunity and actual sleep.
Its limitation is also simplicity. Sleep efficiency cannot tell you why sleep was fragmented, whether your breathing was normal, whether leg movements disrupted sleep, whether a medication contributed, or whether your circadian timing is misaligned. A low percentage is a signal to interpret, not a diagnosis.
Evidence from sleep medicine and behavioral sleep approaches suggests that improving the match between time in bed and actual sleep ability can help consolidate sleep for some people. Cognitive behavioral therapy for insomnia often includes concepts such as sleep restriction or sleep compression, where the sleep window is adjusted under appropriate guidance. These methods should not be copied aggressively without considering safety, daytime sleepiness, medical conditions, driving risk, or professional advice.
Fragmented sleep and insufficient sleep are linked to worse cardiovascular, cognitive, and mood outcomes at the population level. Those associations are not deterministic for an individual night or a single wearable reading. If you are also tracking resting heart rate, heart rate variability, or overnight heart rate patterns, guides on understanding heart rate during sleep, how heart rate variability changes with age, and how to understand your HRV values can help connect sleep disruption with broader recovery signals.
Strategies to discuss with a professional
The safest improvement path starts with the least intensive levers. The goal is not to force sleep. It is to make the sleep opportunity more realistic, reduce avoidable disruption, and identify patterns that deserve evaluation.
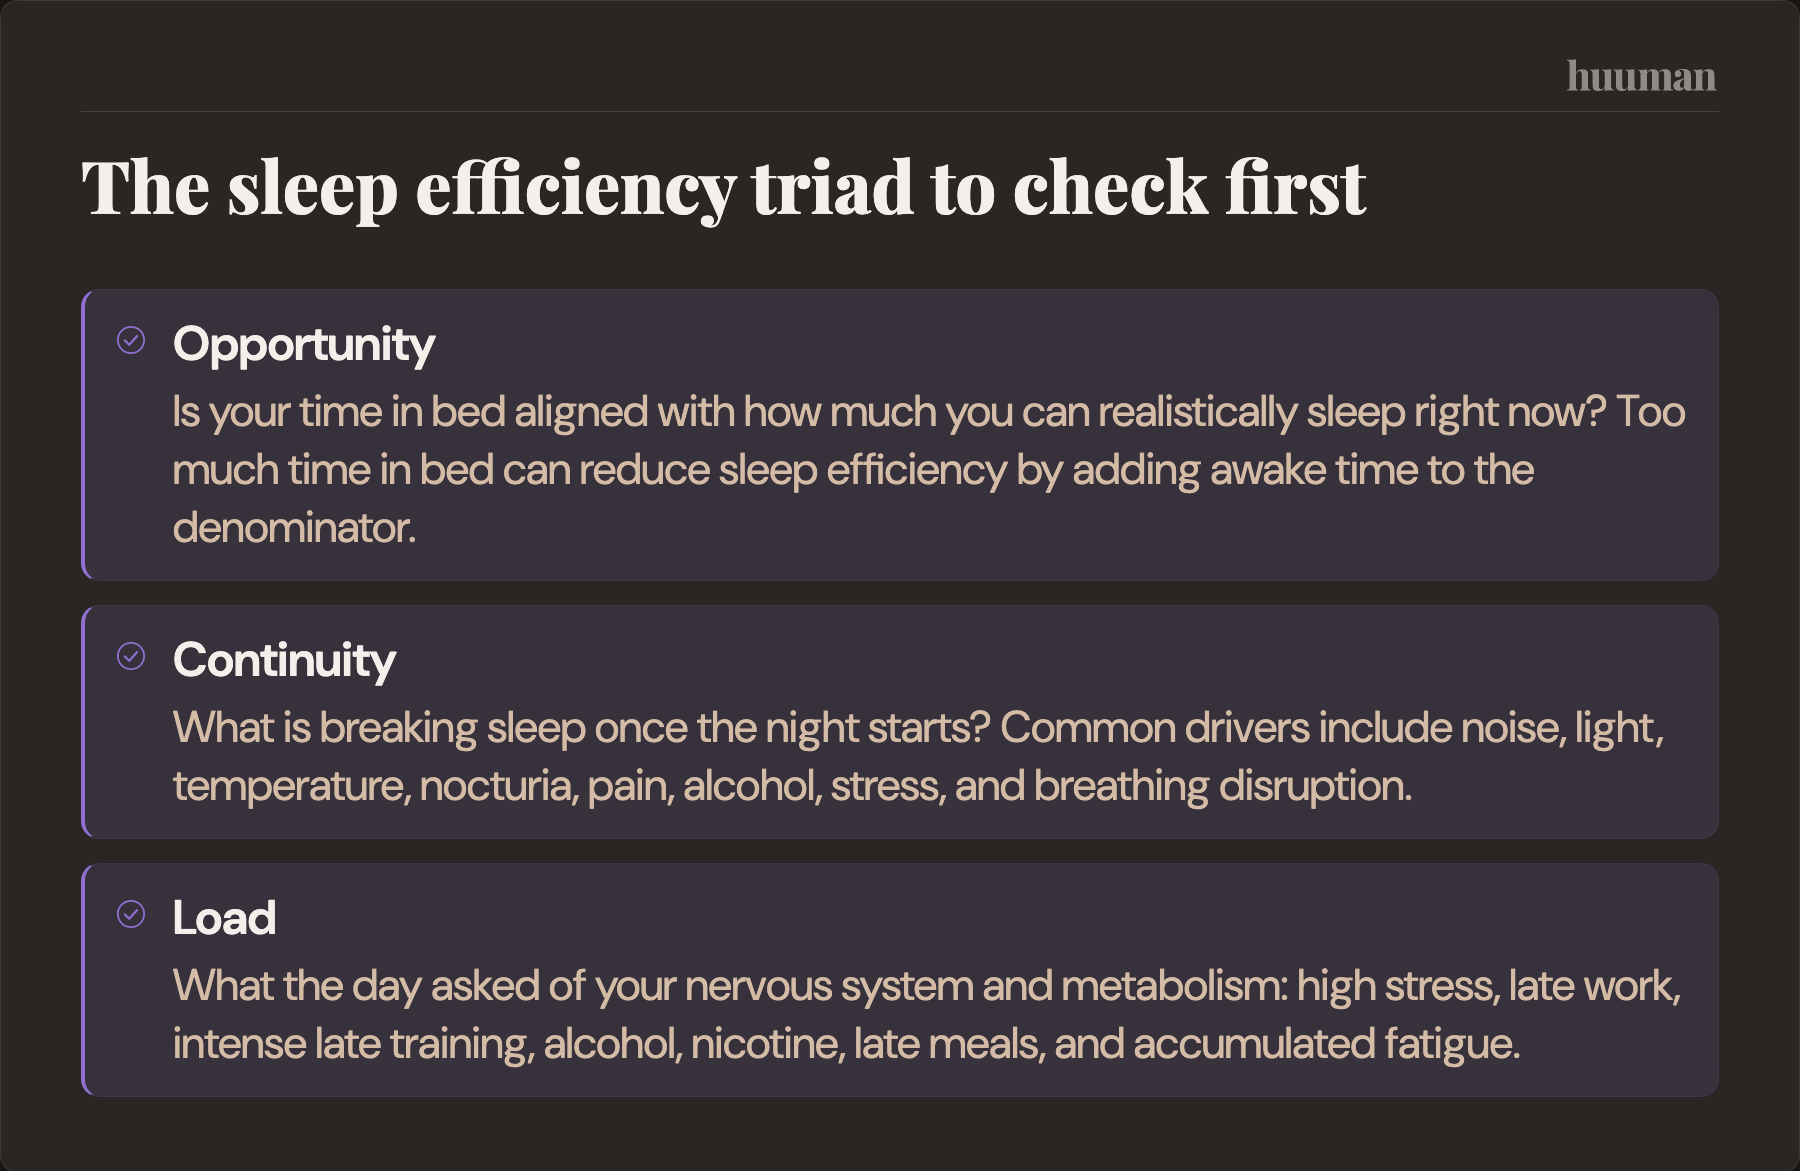
A practical sleep efficiency triad
- Opportunity: Is your time in bed aligned with how much you can realistically sleep right now? Too much time in bed can reduce sleep efficiency by adding awake time to the denominator.
- Continuity: What is breaking sleep once the night starts? Common drivers include noise, light, temperature, nocturia, pain, alcohol, stress, and breathing disruption.
- Load: What did the day ask of your nervous system and metabolism? High stress, late work, intense late training, alcohol, nicotine, late meals, and accumulated fatigue can all affect sleep continuity.
Many behavioral sleep programs use some version of adjusting the sleep opportunity window. In plain terms, that means reducing unnecessary awake time in bed without cutting sleep so aggressively that daytime safety or function suffers. This is especially relevant for people who spend nine or ten hours in bed trying to “catch up” but sleep only part of that window.
Continuity levers are less glamorous but often more valuable: a darker room, less noise, a cooler and more stable sleep environment, a real boundary between work and bed, and fewer late-night inputs that keep the brain engaged. For people with rumination, a short cognitive offload earlier in the evening may help separate planning from sleep.
Timing levers matter because sleep is not isolated from the rest of the day. Caffeine timing, alcohol, nicotine, late meals, glucose swings, and late high-arousal training can affect sleep latency or WASO in some people. Fitness-minded readers should also consider total training load. If sleep efficiency drops during heavy blocks, the issue may not be bedtime hygiene, but accumulated stress. The guide on how long a deload should last gives more context on managing load rather than adding more recovery hacks.
Pain, discomfort, restless legs symptoms, and frequent urination are not mindset problems. If they persist, they deserve practical attention and, when appropriate, medical evaluation. Loud snoring, witnessed apneas, choking or gasping, severe daytime sleepiness, drowsy driving, chest pain, new palpitations at night, severe nocturnal shortness of breath, depression symptoms, suicidal ideation, or severe anxiety affecting sleep should be taken seriously.
A 7-day minimal effective experiment
For busy professionals, a simple 7-day structure is often more useful than a complicated protocol. A commonly used approach is to keep wake time consistent, create a 30 to 60 minute boundary from work and screens before bed, and set a realistic time-in-bed window based on recent sleep rather than an idealized target. This is not a prescription. It is a way to learn whether schedule consistency and reduced arousal improve consolidation.
How to track and interpret changes
Track sleep efficiency over 2 to 4 weeks, not one night. Night-to-night variability means a single night can be thrown off by many factors. Trends reveal whether the problem is persistent and whether changes are actually helping.
A useful 14-night Sleep Consolidation Log can be built with the following fields:
- Date: Useful for spotting weekday versus weekend patterns.
- Time in bed: Bedtime and final out-of-bed time.
- Total sleep time: From diary, wearable, or both.
- Sleep efficiency: TST divided by TIB, multiplied by 100.
- Sleep latency: How long it felt like it took to fall asleep.
- Awakenings and WASO: Number of awakenings and estimated awake time after sleep onset.
- Context: Alcohol, caffeine timing, late meal, training time and intensity, stress rating, pain, room temperature, noise, and travel.
- Daytime function: Sleepiness, focus, mood, cravings, and training readiness.
Here is one filled example row: Monday, in bed 10:45 p.m. to 6:30 a.m., estimated sleep 6 hours 40 minutes, sleep efficiency 86%, latency 25 minutes, two awakenings, late caffeine at 3 p.m., evening strength session, stress high, daytime focus moderate.
Review weekly averages and variability. If the average improves but total sleep time falls, you may have tightened the window too much. If total sleep time improves but efficiency stays low, fragmentation may still be present. If both improve and daytime function improves, the change is more likely to be meaningful.
Rather than trying to decode every fluctuation alone, your huuman Coach can interpret trends and adapt weekly plans using sleep, recovery, training load, and real-life constraints as part of the same picture.
Tracker translation chart
- Wearable says low efficiency, diary says you slept okay: The device may have detected restlessness or misread wakefulness. Compare the trend with daytime function before changing anything.
- Diary says long awakenings, wearable misses them: Quiet wake may have been counted as sleep. Give the diary more weight for lived experience.
- Sleep study shows disruption, wearable looked normal: Consumer devices may miss breathing events, limb movements, or stage-specific disruption. Follow the clinical interpretation.
- Two devices disagree: They may use different sensors and algorithms. Pick one consistent method for trends instead of averaging multiple scores.
- Firmware update changes your sleep efficiency: Treat the shift cautiously. Look for matching changes in sleep timing, symptoms, and daytime function.
If you are comparing sleep duration across contexts, the guide on average sleep duration in Germany gives population-level perspective. For family sleep disruption, resources on baby sleep duration and sleep duration for three-year-olds can help separate your personal sleep pattern from the reality of.
Signal vs noise
- One low-efficiency night after travel is usually noise. Look for whether the number normalizes after your schedule and light exposure stabilize.
- Persistent low efficiency with long time in bed often signals mismatch. Compare your sleep opportunity window with your actual average total sleep time.
- High efficiency with short sleep can still mean under-sleeping. Check total sleep time and daytime sleepiness before celebrating the percentage.
- Alcohol can make you sleepy but fragment the night. Note whether WASO, awakenings, heart rate, or next-day alertness change after drinking.
- Late intense training affects some people more than others. Track training time, intensity, and sleep latency for several weeks.
- Snoring or gasping matters more than a small score change. Treat breathing-related flags as a reason to seek appropriate evaluation.
- Quiet wakefulness can fool wearables. Use a diary when your lived experience does not match the device.
- Big improvements usually come from consistency, not hacks. Regular bedtimes and wake-up times are favourably associated with health, so start with wake time and your sleep window; a calmer environment and lower evening arousal may help too before chasing advanced tactics.
- Overnight heart signals add context, not certainty. If you are training hard, understanding athlete resting heart rate can help you interpret recovery trends, since combining resting heart rate with HRV offers a more nuanced read of readiness.
Common questions
What does sleep efficiency mean in simple terms?
It means the percentage of your time in bed that you actually spent asleep. If you are in bed for eight hours and sleep for seven, your sleep efficiency is 87.5%. It mainly reflects sleep consolidation.
Is 94% sleep efficiency good?
It can be a good sign if total sleep time is also adequate and you feel functional during the day. If 94% comes from spending too little time in bed, it may simply mean you had a narrow sleep window.
Is sleep efficiency the same as sleep quality?
No. Sleep efficiency measures the relationship between time in bed and time asleep. Sleep quality also includes how restored you feel, sleep depth, mood, alertness, breathing, comfort, and next-day performance.
How can I improve sleep efficiency without sleeping less?
Focus first on continuity: reduce light and noise, stabilize wake time, create a calmer pre-bed boundary, watch alcohol and late caffeine, and identify pain, nocturia, breathing symptoms, or stress patterns. Avoid cutting time in bed so much that total sleep suffers.
Why is my sleep efficiency low even when I am in bed for 8 hours?
The most common reasons are long sleep latency, wake after sleep onset, or early morning awakenings. Stress, alcohol, caffeine timing, pain, temperature, noise, irregular schedules, and sleep disorders can all contribute.
Can my Apple Watch, Oura, WHOOP, or Fitbit accurately measure sleep efficiency?
They can be useful for trends, but they estimate sleep rather than directly measuring it like a clinical sleep study. They may misclassify quiet wake as sleep and should not be used to diagnose insomnia, obstructive sleep apnea, restless legs syndrome, or circadian rhythm sleep-wake disorders.
What is normal sleep efficiency by age?
Sleep efficiency tends to decline with age at the population level, but there is no single normal number that applies to everyone. Interpret your trend with total sleep time, daytime function, health status, medications, schedule, and symptoms.
When should I worry about low sleep efficiency?
Low sleep efficiency deserves more attention when it persists for weeks, affects daytime function, or appears with loud snoring, witnessed apneas, choking or gasping, excessive sleepiness, drowsy driving, restless legs symptoms, significant distress, severe anxiety, depression symptoms, or concerning nighttime cardiac or breathing symptoms.
Sleep efficiency is most useful when it improves decision quality. Use it to ask better questions about your sleep window, continuity, daily load, and recovery signals, not to chase a perfect number. If you also track estimated sleep stages, the guide to deep sleep duration can help you keep stage data in perspective.
More health topics to explore
- Sleep & Recovery – Overview
- Too Little REM Sleep: Causes, Tracking Errors, and Safe Ways to Improve It
- Anti-Age Pillow: Do “Anti-Wrinkle” Pillows Work, and Which Type Fits You?
- Signs You Need a Deload Week
References
- Haghayegh S et al. — Accuracy of Wristband Fitbit Models in Assessing Sleep: Systematic Review and... (2019)
- Khan MS & Aouad R — The Effects of Insomnia and Sleep Loss on Cardiovascular Disease (2022)
- Chronic Insomnia — StatPearls, NCBI Bookshelf
- Chaput JP et al. — Sleep timing, sleep consistency, and health in adults: a systematic review (2020)
- Carney CE et al. — The consensus sleep diary: standardizing prospective sleep self-monitoring (2012)
- Lim J et al. — Greater variability in daily sleep efficiency predicts depression and... (2022)
- Combining HRV, resting heart rate, and wellbeing for athlete readiness (2025)
About this article · Written by the huuman Team. Our content is based on peer-reviewed research and clinical guidelines. We follow editorial standards grounded in scientific evidence.
This article is for educational purposes only and does not constitute medical advice. Health and training decisions should be discussed with qualified professionals.

